
Existing Solutions
Existing Solutions
One common method of detecting LLPS is through the use of confocal microscopy. Wang et al. have outlined several assays for detecting and analyzing droplets formed by LLPS. In these assays, 10 μL of protein solution are placed on a glass slide and morphologically assessed with a confocal microscope. One advantage of confocal microscopy is that protein aggregates appear morphologically different than condensates formed by LLPS. Condensates are liquid-like and thus display wetting and fusion behavior while aggregates are solid-like and do not readily change shape. Additionally, turbidity assessments of protein solutions or quantitative sedimentation assays can be done to assess LLPS. Turbidity can be measured by OD600nm or by eye. Sedimentation assays can be done by high power centrifugation. During centrifugation, the dense condensates pellet while the dilute phase protein remains in the supernatant. The gel electrophoresis band density of liquid supernatant versus pelleted solutions can be quantified to represent the ratio of concentrations of each phase. While the confocal microscope measures described by Wang et al. can assess liquid dynamic behavior of droplets, assays are inherently limited to one sample. Centrifugation and turbidity must also be done one sample at a time. Additionally, Wang et al. did not describe any measures to assess temperature dependent phase separation (2018). These common measures of investigating LLPS highlight the need for more high throughput assessments.
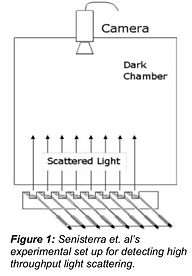
Differential static light scattering has been used to measure temperature dependent denaturation and subsequent aggregation of recombinantly expressed proteins. Since both aggregation and phase separation cause increases in scattering intensity, these approaches ought to be considered as potential existing solutions to measure LLPS as well. Researchers measured scattering of unlabeled protein samples on a 384 well plate; thus, many sample wells were available for testing. The experimental set-up consisted of a 384 well plate sitting on top of a heating block with matching holes fit to the plate. The wells were simultaneously illuminated through holes in the heating plate using an array of 620-nm light-emitting diodes and scattering intensity was measured with a camera, as seen in Figure 1. The heating block was gradually heated, and images were taken intermittently throughout the heating process. Post-collection image processing was used to determine scattering intensity from captured images. The entire data collection and analysis process took a little over 1 hour and the lowest sample concentration that could be measured with sufficiently high signal to noise ratios was 2.5 μM. All of the described experiments were done with the Epiphyte3 Stargazer instrument rather than an in-house adaptation of standard SRALS (Senisterra et al., 2006).
The use of multiple light sources described by Senisterra et al’s methods marks an innovative approach to detect scattering in a high throughput manner. Additionally, loading samples into a 384 well plate, whose maximum well volume is about 50 μL decreases needed sample volume compared to the Pappu Lab set up. However, the necessary concentration of 2.5 μM to achieve a sufficient signal to noise ratio is above that of standard SRALS, namely because a camera is used to measure all scattered light simultaneously instead of one detector corresponding to one laser. Further, the light-emitting diodes can only transmit 620 nm waves. One key advantage of the Pappu Lab’s current SRALS set up is the customizable laser wavelength. Thus, the solution of Senisterra et. all to detect high throughput light scattering does not fully meet the needs of the Pappu Lab.
As mentioned above, one possible solution to increase throughput of sample analysis is to increase the number of light sources operating in unison during data collection. An alternative existing solution was found in a paper written by Turner et al. The focus of this experiment was to build a 3-axis motorized stage that was highly customizable and significantly cheaper than other commercial options, with a complete assembly cost less than $1000. This stage was built to be compatible with the optical path of a two-photon microscope and enabled researchers to collect time-lapse imaging of multiple locations in a sample, automate tracking of the stage, build image mosaics, and acquire 3D data, as seen in Figure 2.
The positional accuracy of the stage allowed a minimum incremental motion of 0.04 μm in the Z direction and 0.1 μm in the X and Y directions with speeds of 1.2 mm/s in the Z direction and 1.8 mm/s in the X and Y directions. Additionally, the unidirectional positioning repeatability, describing the accuracy with which the stage can repeatedly return to the same position, was 1 μm or better in the X and Y directions and 0.1 μm or better in the Z direction. This stage can be positioned through the use of a hand-held controller or automatically through
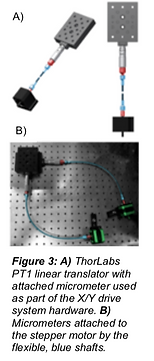
a PC serial port. The stage was assembled so linear translations could be elicited by rotary motion through the use of micrometers. The purpose of the micrometers was to provide a low gear ratio, but the paper also mentioned that a lead screw with a rack and pinion set up would provide the same functionality. Because micrometers were designed to be used manually, in order to motorize them, stepper motors were connected to the micrometers via flexible shafts, as can be seen in Figure 3.
The use of stepper motors and the ability to control X, Y, and Z positioning on the micrometer scale are inventive solutions to reducing cost while maintaining accuracy for the motorized sample stage. The flexibility of the programmable positioning would also decrease active time necessary for experimentation. However, the apparatus in this experiment was built to be compatible with a two-photon microscope, and therefore did not have as many spatial design restrictions. In order to fulfill the needs of the Pappu lab, the motorized stage would have to be compatible with their current SRALS set up and allow for the addition of temperature regulating equipment.
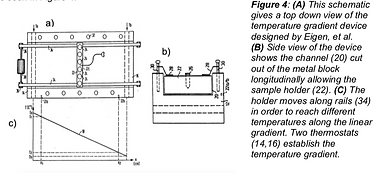
As stated previously, the lab needs a device that allows for efficient high throughput measurements across a temperature range. An existing solution was to have samples spanning a temperature gradient in order to see the results over a wide range as was created by Eigen, et al (1993). In this iteration of the idea, a temperature gradient was established using two thermostats at either end of a metal block. The samples could then be moved along the main body to bring the sample to any temperature within this gradient. A schematic of the device can be seen in Figure 4.
The main benefit of this solution from other devices was the addition
of the second thermostat. Many other devices attempting to create a
temperature gradient relied on one thermostat and radiation to
establish a temperature gradient. The second thermostat made the
temperature range more controlled, allowed the temperature specification to be more calculable, and provided the ability to move the sample along the body to quickly establish a new temperature. This speed was an improvement over resource consuming water baths. Although the device allowed for a sample to be exposed to a range of temperatures quickly, it was not compatible with SRALS measurements. Further, it did not allow for high throughput measurements at small sample sizes.
One more iteration of a temperature gradient that was directly relevant to this project was one developed by Danssaert, et al (1998). Similar to Eigen, et al., Danssaert, et al. established a temperature gradient across a metal block. This block had wells distributed across the top in order to observe reactions occurring over a range of temperatures. The temperature gradient was established using two thermostats. The main feature of interest was the grid of wells along the temperature gradient to observe the reactions occurring simultaneously across the entire range. However, this design did not fulfill the project need due to the incompatibility with the client’s SRALS laser and detector set up.

References
Campbell, R. A., Eifert, R. W., & Turner, G. C. (2014). OpenStage: a low-cost
motorized microscope stage with sub-micron positioning accuracy. PloS one, 9(2), e88977. doi:10.1371/journal.pone.0088977
Danssaert, J. L., Shopes,, R. J., & Shoemaker, D. D. (1998). U.S. Patent No. 5,779,981. Washington, DC: U.S. Patent and Trademark Office.
Eigen, M., Otten, H., & Bauer, G. (1993). U.S. Patent No. 5,224,536. Washington, DC: U.S. Patent and Trademark Office.
Senisterra, G. A., Markin, E., Yamazaki, K., Hui, R., Vedadi, M., & Awrey, D. E. (2006).
Screening for ligands using a generic and high-throughput light-scattering-based assay.
Journal of Biomolecular Screening, 11(8), 940-948.
Wang, Z., Zhang, G. & Zhang, H. (2018). Protocol for analyzing liquid-liquid phase separation.
Biophysics Reports, 5(1), 1-9.